Introduction to Swift programming
Getting started with Swift Programming
Swift is an Objective-C based programing language, designed by Apple inc. specially for Apple computer devices.
Originally a proprietary specification, After 2015 with the introduction of Swift 2.2, it is now an open-source standards.
Swift are designed to be use to write an application for the Apple devices, in which the performance are optimized for, but it also contains many powerful mathematical operations, in which if use with modern Apple devices which contains an dedicated Neural Engine to help accelerate mathematical operations, it allows the apps to perform complex mathematical operation on the fly and provide user with a more seamless app user experience.
To keep in line with our theme of using computer programming to help visualize interpolation, we'll demonstrate how we can use Swift to write a simple iPhone application to help visualize linear and polynomial interpolations.
Overview of our iPhone app with Swift.
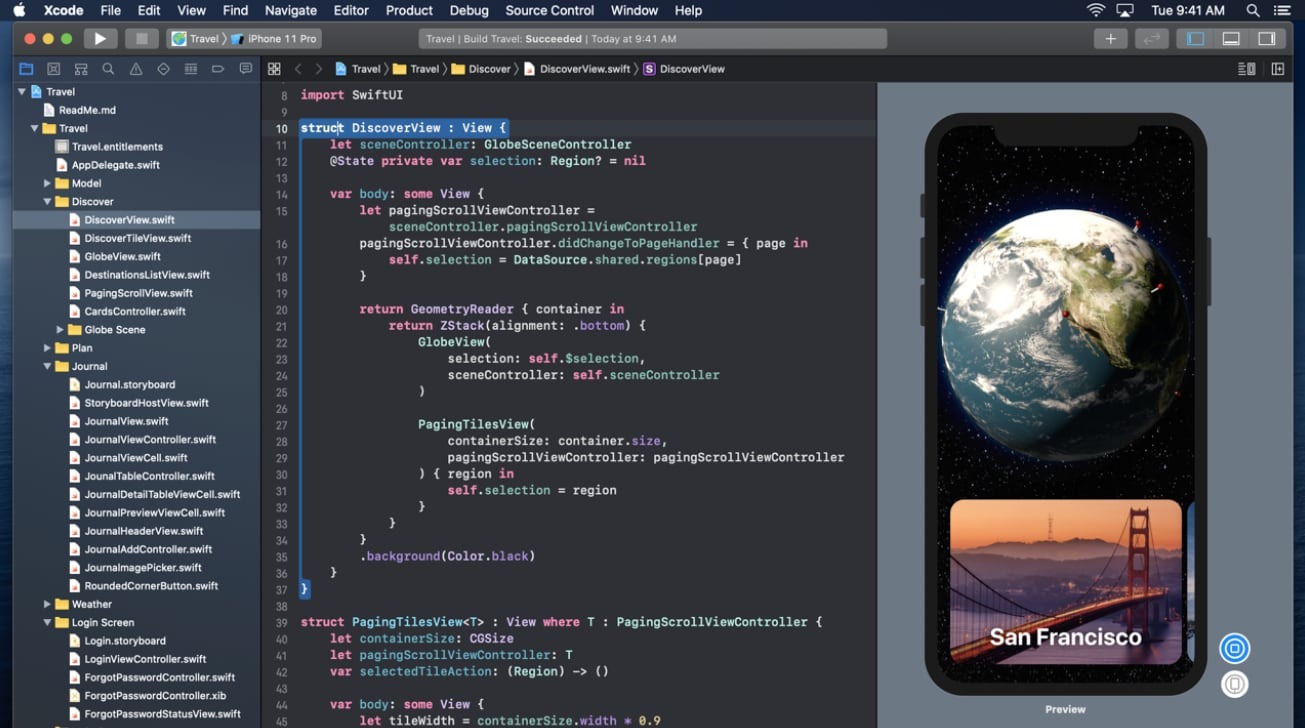
Even though Swift are open source standards and is describe to be cross-platform, for sake of simplicity we'll write the iPhone app on the iPhone, using Xcode IDE
For start, our app will have the following components.
1. Graph viewing area
2. Toggle button for Linear/Polynomial interpolation algorithm.
3. Toggle switch for Line/Dots display
3. A button to randomly generate some datapoints
We'll also divide the coding section into 2 sections, the frontend and the backend.
In this post, we'll look at the frontend section of the app: the UI.
The UI

To help simplified the code, we'll divide the code into small "blocks"

The first block first initialize the UI library (SwiftUI) and create a new "Window" for our app.
The code then initialize some starting parameters of our app, in this case.
The code will first create some variable to store the datapoints, interpolated graphs and it also specifies that the code will first draw the graph as series of "dots" with Linear interpolation.

The second block is used to control the generations of the interpolated graph and the "dots" parameters, in this case, a datapoint is represent with a 6 pixel red circle where that the interpolated graph dots are represented with 2 pixel blue circle.
If the user choose to display a continuous line, a 1 pixel wide blue line will be drawn to represent a interpolated graph.

In the third block, we create some more UI elements which in this case, is the button to create new random datapoints and the toggle between linear and polynomial interpolation and toggle switch for line or dot plots.
These are then associated with the function that will pass the user input to the backend portion of the app.


This conclude the simplified explanation of our Interpolation Visualizer app frontend
In the next post, we'll take a look at the inner workings of the app and how we can use the Neural Engine inside modern iPhone to help accelerate the computation of the interpolation graph.


ความคิดเห็น
แสดงความคิดเห็น